Benchmarking Llama-2-13B
We benchmark the performance of LLama2-13B in this article from latency, cost, and requests per second perspective. This will help us evaluate if it can be a good choice based on the business requirements. Please note that we don't cover the qualitative performance in this article - there are different methods to compare LLMs which can be found here.
Model: Llama2-13B
In this blog, we have benchmarked the Llama-2-13B model from NousResearch. This is a pre-trained version of Llama-2 with 13 billion parameters.
Meta developed and publicly released the Llama 2 family of large language models (LLMs), a collection of pre-trained and fine-tuned generative text models ranging in scale from 7 billion to 70 billion parameters.
Metrics to Benchmark
- Requests per second. (RPS): Requests per second that the model is handling. With higher RPS, the latency usually goes up.
- Latency: How much time is taken to complete an inference request?
- Economics: What are the costs associated with deploying an LLM?
Use cases & Deployment Modes Benchmarked
The key factors across which we benchmarked are:
GPU Type:
- A100 40GB GPU
- 2 x A10 24GB GPU
Prompt Length:
- 1500 Input tokens, 100 output tokens (Similar to Retrieval Augmented Generation use cases)
- 50 Input tokens, 500 output tokens (Generation Heavy use cases)
Benchmarking Setup
For benchmarking, we have used locust, an open-source load-testing tool. Locust works by creating users/workers to send requests in parallel. At the beginning of each test, we can set the Number of Users and Spawn Rate. Here the Number of Users signify the Maximum number of users that can spawn/run concurrently, whereas the Spawn Rate signifies how many users will be spawned per second.
In each benchmarking test for a deployment config, we started from 1 user and kept increasing the Number of Users gradually till we saw a steady increase in the RPS. During the test, we also plotted the response times (in ms) and total requests per second.
In each of the 2 deployment configurations, we have used the huggingface text-generation-inference model server having version=0.9.4. The following are the parameters passed to the text-generation-inference image for different model configurations:
| Parameters | Llama-2-13B on A100 | Llama-2-13B on A10G |
|---|---|---|
| Max Batch Prefill Tokens | 10100 | 10100 |
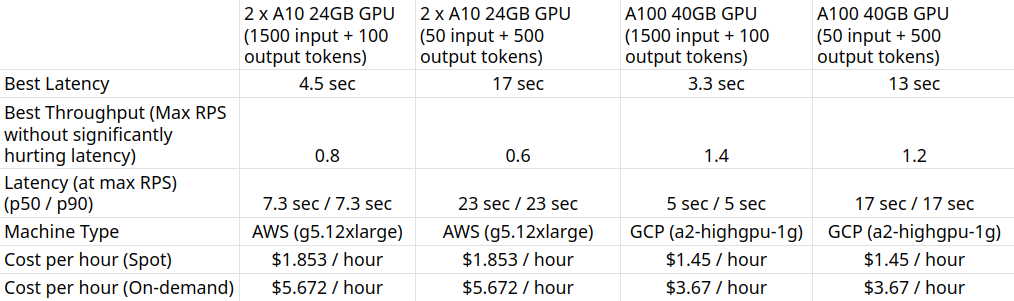
Benchmarking Results Summary
Latency, RPS, and Cost
We calculate the best latency based on sending only one request at a time. To increase throughput, we send requests parallelly to the LLM. The max throughput is the case when the model is able to process the input requests without significant deterioration in latency.
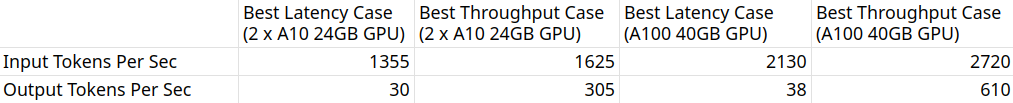
Tokens Per Second
LLMs process input tokens and generation differently - hence we have calculated the input tokens and output tokens processing rate differently.
Detailed Results
2 x A10 24GB GPU (1500 input + 100 output tokens)
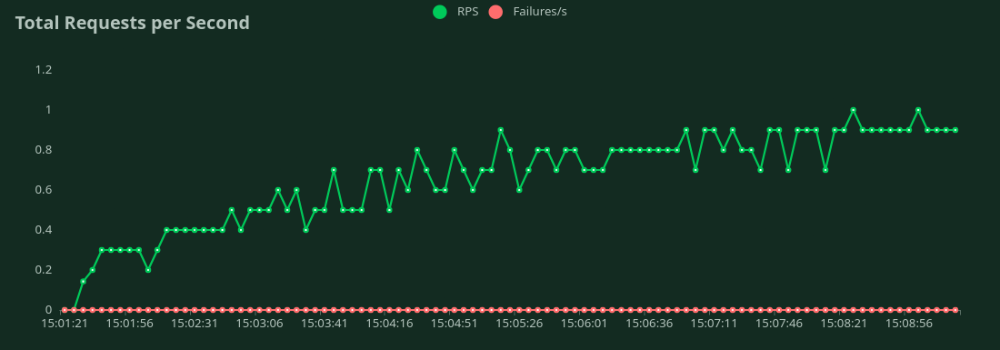
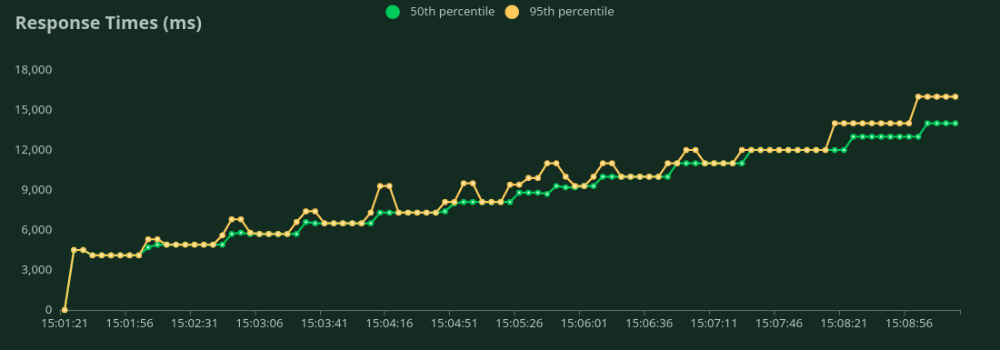
We can observe in the above graphs that the Best Response Time (at 1 user) is 4.5 seconds. We can increase the number of users to throw more traffic at the model - we can see the throughput increasing till 0.8 RPS without a significant drop in latency. Beyond 0.8 RPS, the latency increases drastically which means requests are being queued up.
2 x A10 24GB GPU (50 input + 500 output tokens)
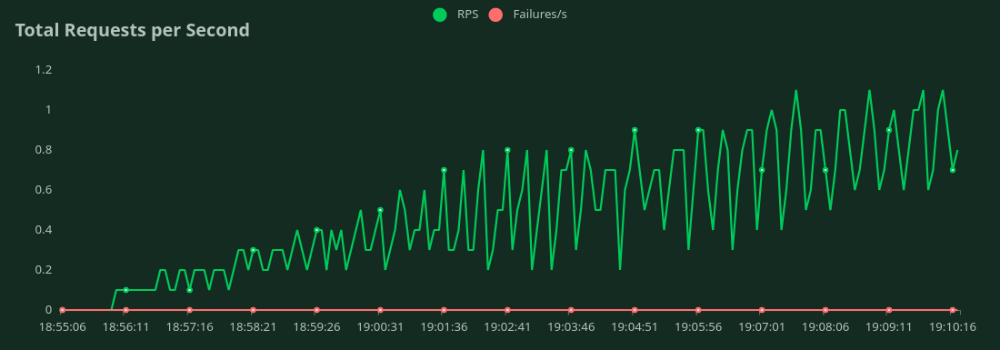
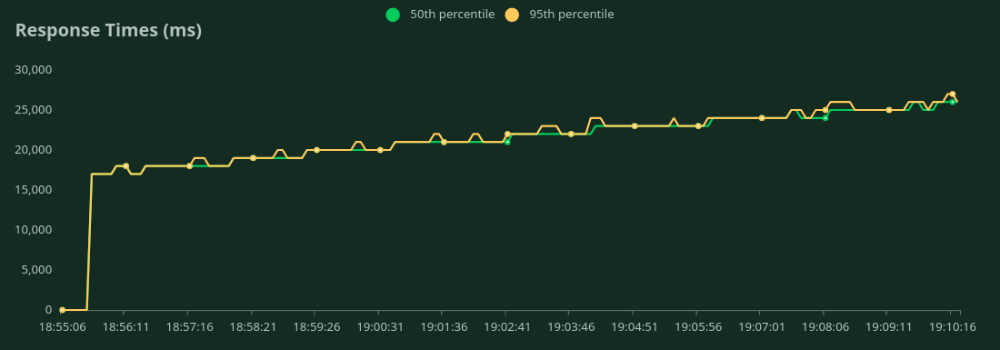
We can observe in the above graphs that the Best Response Time (at 1 user) is 17 seconds. We can increase the number of users to throw more traffic at the model - we can see the throughput increasing till 0.6 RPS without a significant drop in latency. Beyond 0.6 RPS, the latency increases drastically which means requests are being queued up.
A100 40GB GPU (1500 input + 100 output tokens)
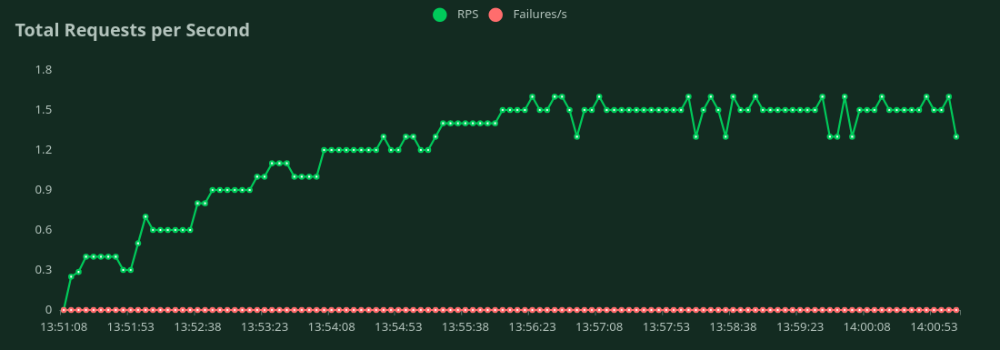
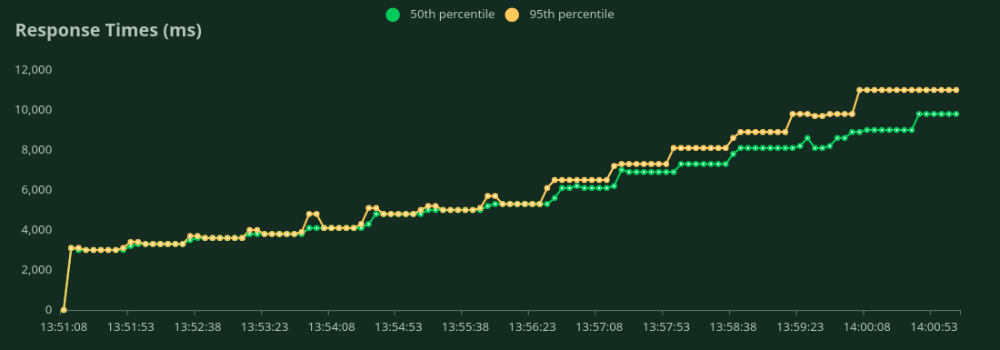
We can observe in the above graphs that the Best Response Time (at 1 user) is 3.3 seconds. We can increase the number of users to throw more traffic at the model - we can see the throughput increasing till 1.4 RPS without a significant drop in latency. Beyond 1.4 RPS, the latency increases drastically which means requests are being queued up.
A100 40GB GPU (50 input + 500 output tokens)
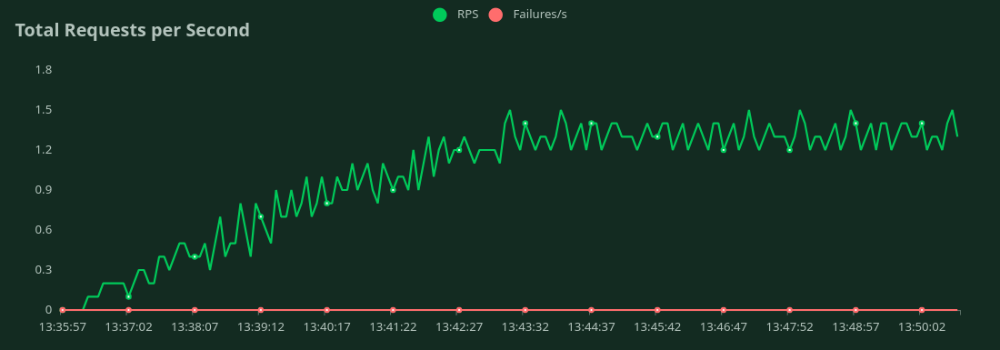
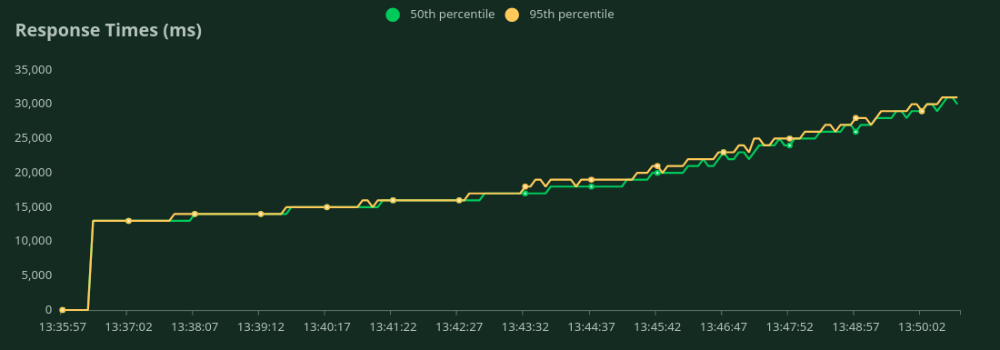
We can observe in the above graphs that the Best Response Time (at 1 user) is 13 seconds. We can increase the number of users to throw more traffic at the model - we can see the throughput increasing till 1.2 RPS without a significant drop in latency. Beyond 1.2 RPS, the latency increases drastically which means requests are being queued up.
Hopefully, this will be useful for you to decide if LLama2-13B will suit your use case and the costs you can expect to incur while hosting LLama2-13B.